

Calculating the Gini index from a Lorenz curve involves a few steps of geometric interpretation. The Gini index is essentially a ratio of the area between the Lorenz curve and the line of perfect equality to the total area under the line of perfect equality. Here’s how to calculate it:
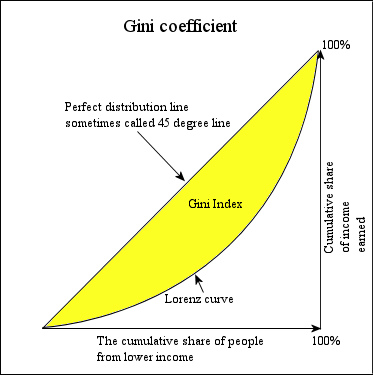
Draw or Identify the Lorenz Curve: First, you need a Lorenz curve, which is a graphical representation of the distribution of income or wealth in a population. This curve is plotted on a graph where the cumulative percentage of total income or wealth is on the y-axis and the cumulative percentage of households or individuals is on the x-axis.
Line of Perfect Equality: This is a straight line from the bottom left corner (0,0) to the top right corner (100, 100) of the graph. It represents a situation where every cumulative percentage of the population has an exactly proportional share of income or wealth.
Calculate the Area between the Lorenz Curve and the Line of Equality: The Gini index is essentially this area, but it can be challenging to calculate directly. A common approach is to use the trapezoidal rule or numerical integration if the Lorenz curve is given by a function.
Calculate the Total Area under the Line of Equality: This area is a right triangle with a base and height of 1 (or 100%, depending on your scale), so its area is 0.5 (or 50% for a percentage scale).
Compute the Gini Coefficient: The Gini index is calculated as the ratio of the area between the Lorenz curve and the line of equality to the total area under the line of equality. Mathematically, it is expressed as:
Gini Index = Area between Lorenz curve and line of equality / Total area under the line of equality
In practice, this is often simplified to:
Gini Index = 1 − 2 × Area under the Lorenz curve
This simplification comes from the fact that the total area under the line of equality is 0.5, and the Gini index is double the area between the Lorenz curve and the line of equality.
Interpreting the Gini Coefficient: The Gini coefficient ranges from 0 (perfect equality) to 1 (perfect inequality). A higher Gini coefficient indicates greater inequality in the income or wealth distribution.
In practice, especially when dealing with real-world data, the Lorenz curve may not be a smooth function, and the Gini index might need to be approximated using numerical methods or by dividing the population into segments and approximating the Lorenz curve as a series of line segments.